Presentación de ejemplo · Escuela
Climate change
Contenido de la presentación
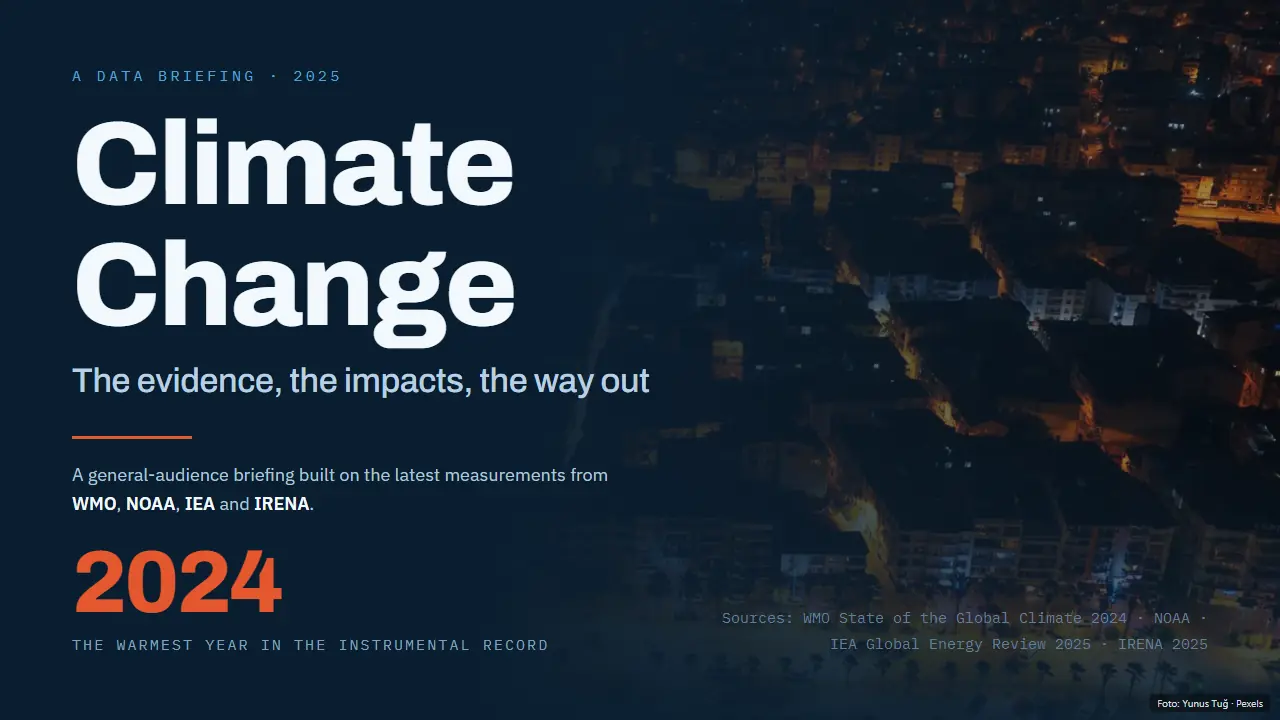
Lámina 1 Climate Change
A Data Briefing · 2025 · The evidence, the impacts, the way out · A general-audience briefing built on the latest measurements from WMO, NOAA, IEA and IRENA. · The warmest year in the instrumental record · Sources: WMO State of the Global Climate 2024 · NOAA · IEA Global Energy Review 2025 · IRENA 2025
Lámina 2 What is climate change
The mechanism · The greenhouse effect is natural. Gases like CO₂ and methane trap heat radiating from Earth’s surface — without them, the planet would be about 33 °C colder. · The problem is the dose. Burning coal, oil and gas, plus deforestation and agriculture, have raised greenhouse gas concentrations to levels unseen in at least 800,000 years. · More trapped heat means more energy in the climate system: warmer air and oceans, melting ice, rising seas, and a more volatile atmosphere. · Weather vs. climate · Weather is what we feel day to day; climate is the long-term average. Climate change is a shift in that average — and in the extremes around it. · Fig. 1 — How the greenhouse effect works: heat radiates up, the atmosphere bounces it back. · 33 °C colder without greenhouse gases
Lámina 3 The evidence — 2024, warmest year on record
The evidence · Warmest year on record · 1.55 °C · ± 0.13 · consolidated WMO figure above the 1850–1900 pre-industrial average · 2024 was the warmest year since records began in 1850 — and likely the first calendar year to exceed 1.5 °C, the threshold at the heart of the Paris Agreement. · Warmest year on record · since records began in 1850 · Ten warmest years on record · the last ten years, one after another
Lámina 4 The Keeling curve: CO₂ never stops climbing
Atmospheric carbon dioxide · 427 ppm · May 2024 — the highest monthly value ever recorded at Mauna Loa. · +4.7 ppm / year · The largest 12-month gain ever observed, set in March 2024. · The curve never flattens. Every year adds to the total — and the additions are accelerating. · Source: NOAA / Scripps, Mauna Loa Observatory
Lámina 5 Where the emissions come from
The causes · Energy is the thread through nearly every source. Global energy-related CO₂ emissions reached a new record in 2024, around 37.8 Gt — the mix on the left is what any climate plan has to change. · Why it matters · Electricity and heat, transport, buildings, industry and agriculture each need their own fix — there is no single switch to flip. · Sources: Our World in Data · IEA Global Energy Review 2025
Lámina 6 Oceans and ice
The ocean takes the brunt of a warming planet: it absorbs most of the excess heat, its surface climbs, and the frozen world keeps retreating. The satellites have been watching it happen. · Sea level · The rate of global sea-level rise has doubled over the past three decades, measured by satellite altimetry. · Ocean heat · Record · Ocean heat content reached record levels in 2024 — the ocean absorbs most of the excess heat trapped by greenhouse gases. · Glaciers & sea ice · Glaciers and sea ice keep shrinking; 2024 set further records for glacier mass loss.
Lámina 7 The weather is changing with the climate
Impacts · People & Extremes · A warmer atmosphere holds more moisture and carries more energy — and the extremes follow. · Hotter, heavier, longer · Heatwaves get hotter, downpours get heavier, and droughts run longer. · 2024: extremes on every inhabited continent · Exceptional floods, tropical cyclones, heat and drought, with massive economic and social upheaval. · The unfair burden · Loss and damage falls hardest on communities that contributed least to the problem.
Lámina 8 1.5°C — why the threshold matters
The threshold · What 1.5°C means · Every fraction of a degree multiplies the risks: heat extremes, crop stress, coral loss and ecosystem shifts. · The Paris Agreement set the goal of holding warming well below 2°C and pursuing 1.5°C. · Where we stand · 2024 likely passed 1.5°C for a single year — but long-term warming averaged over decades remains just below it. · The goal is not yet dead, but in grave danger: the difference between 1.5°C and 2°C is measured in lives, harvests and coastlines. · Scale: global mean warming above pre-industrial baseline, °C
Lámina 9 Clean energy is winning on cost
The way out · Cost since 2010 · Utility-scale solar LCOE has fallen 90% since 2010, to $0.043/kWh in 2024 — about 41% below the cheapest new fossil-fuel alternative. · And it keeps growing · Renewables were again the most cost-competitive source of new power in 2024: 91% of newly commissioned utility-scale capacity beat the cheapest fossil alternative. · The transition is no longer a sacrifice — it is the economical choice. The faster it goes, the safer the climate. · Source: IRENA, Renewable Power Generation Costs in 2024
Lámina 10 What it takes — and closing
What it takes · 01 · Mitigate · Cut emissions fast · Shift power to renewables, electrify transport and heating, and stop adding CO₂ to the atmosphere within decades. · 02 · Restore · Protect and restore · Forests, wetlands and soils absorb carbon — keeping them intact is climate policy too. · 03 · Prepare
Fotos: Foto: Lâm Trần · Pexels; Foto: Yunus Tuğ · Pexels